Web view window
The Web view window has two data areas. The upper pane displays the same data from four different points of view: by servers, clients, pages, and requests. Expanding the data in Servers, Clients, and Pages views displays the individual requests nested underneath.
The lower pane of the Web view window contains four tabs which present additional information about selected rows in the upper panes: web details, client and server headers, the contents of a selected request, or a packet timing graph representing the packets and phases of an individual request.
The parts of the Web view window are identified below.
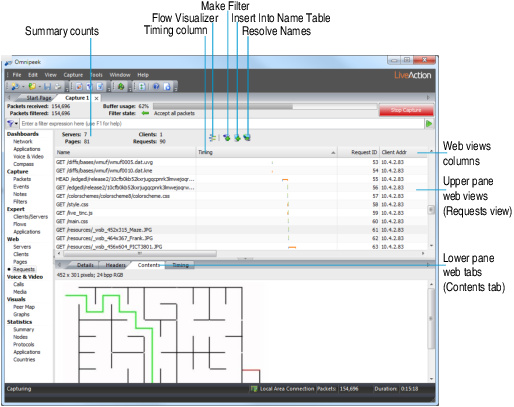
• Summary counts: This area displays the total count of servers, clients, pages, and requests in this capture.
• Flow Visualizer: Opens the selected item (Request, Page, etc.) in a Flow Visualizer tab (see Flow Visualizer).
• Make Filter: Opens the Insert Filter dialog to create a filter based on the selected item.
• Insert Into Name Table: Opens a dialog to add the client and server node addresses of the selected item into the Name Table.
• Resolve Names: Checks the DNS server for a name to match the client and server addresses of the selected item.
• Web view columns: Right-click the column headers to select the columns you wish to display. For more display options, see Web view columns.
For a complete list and description of the available columns in the Web views, see Web view columns.
• Timing column: Displays duration, packets, and phases of each HTTP request. The Timing column is hidden by default. To display the column, right-click the column header and select Timing. For details, see Timing column.
• Upper pane web views: This area displays web data in four formats: by server, client, page, and request. See Web upper pane views.
• Lower pane web tabs: This area displays additional information corresponding to a selected row or rows of upper pane data in the following four formats: web details, headers, contents, and packet timing graph. See Web lower pane tabs.
• Right-click options include:
• Flow Visualizer: Opens the selected item (Request, Page, etc.) in a Flow Visualizer tab. See Web save functions.
• Open Payload in Associated Viewer: Opens payload directly from Web view. See Open payload in associated viewer.